The Analytics overview
Read your store's sales, visits, orders and customers for any dates, card by card.
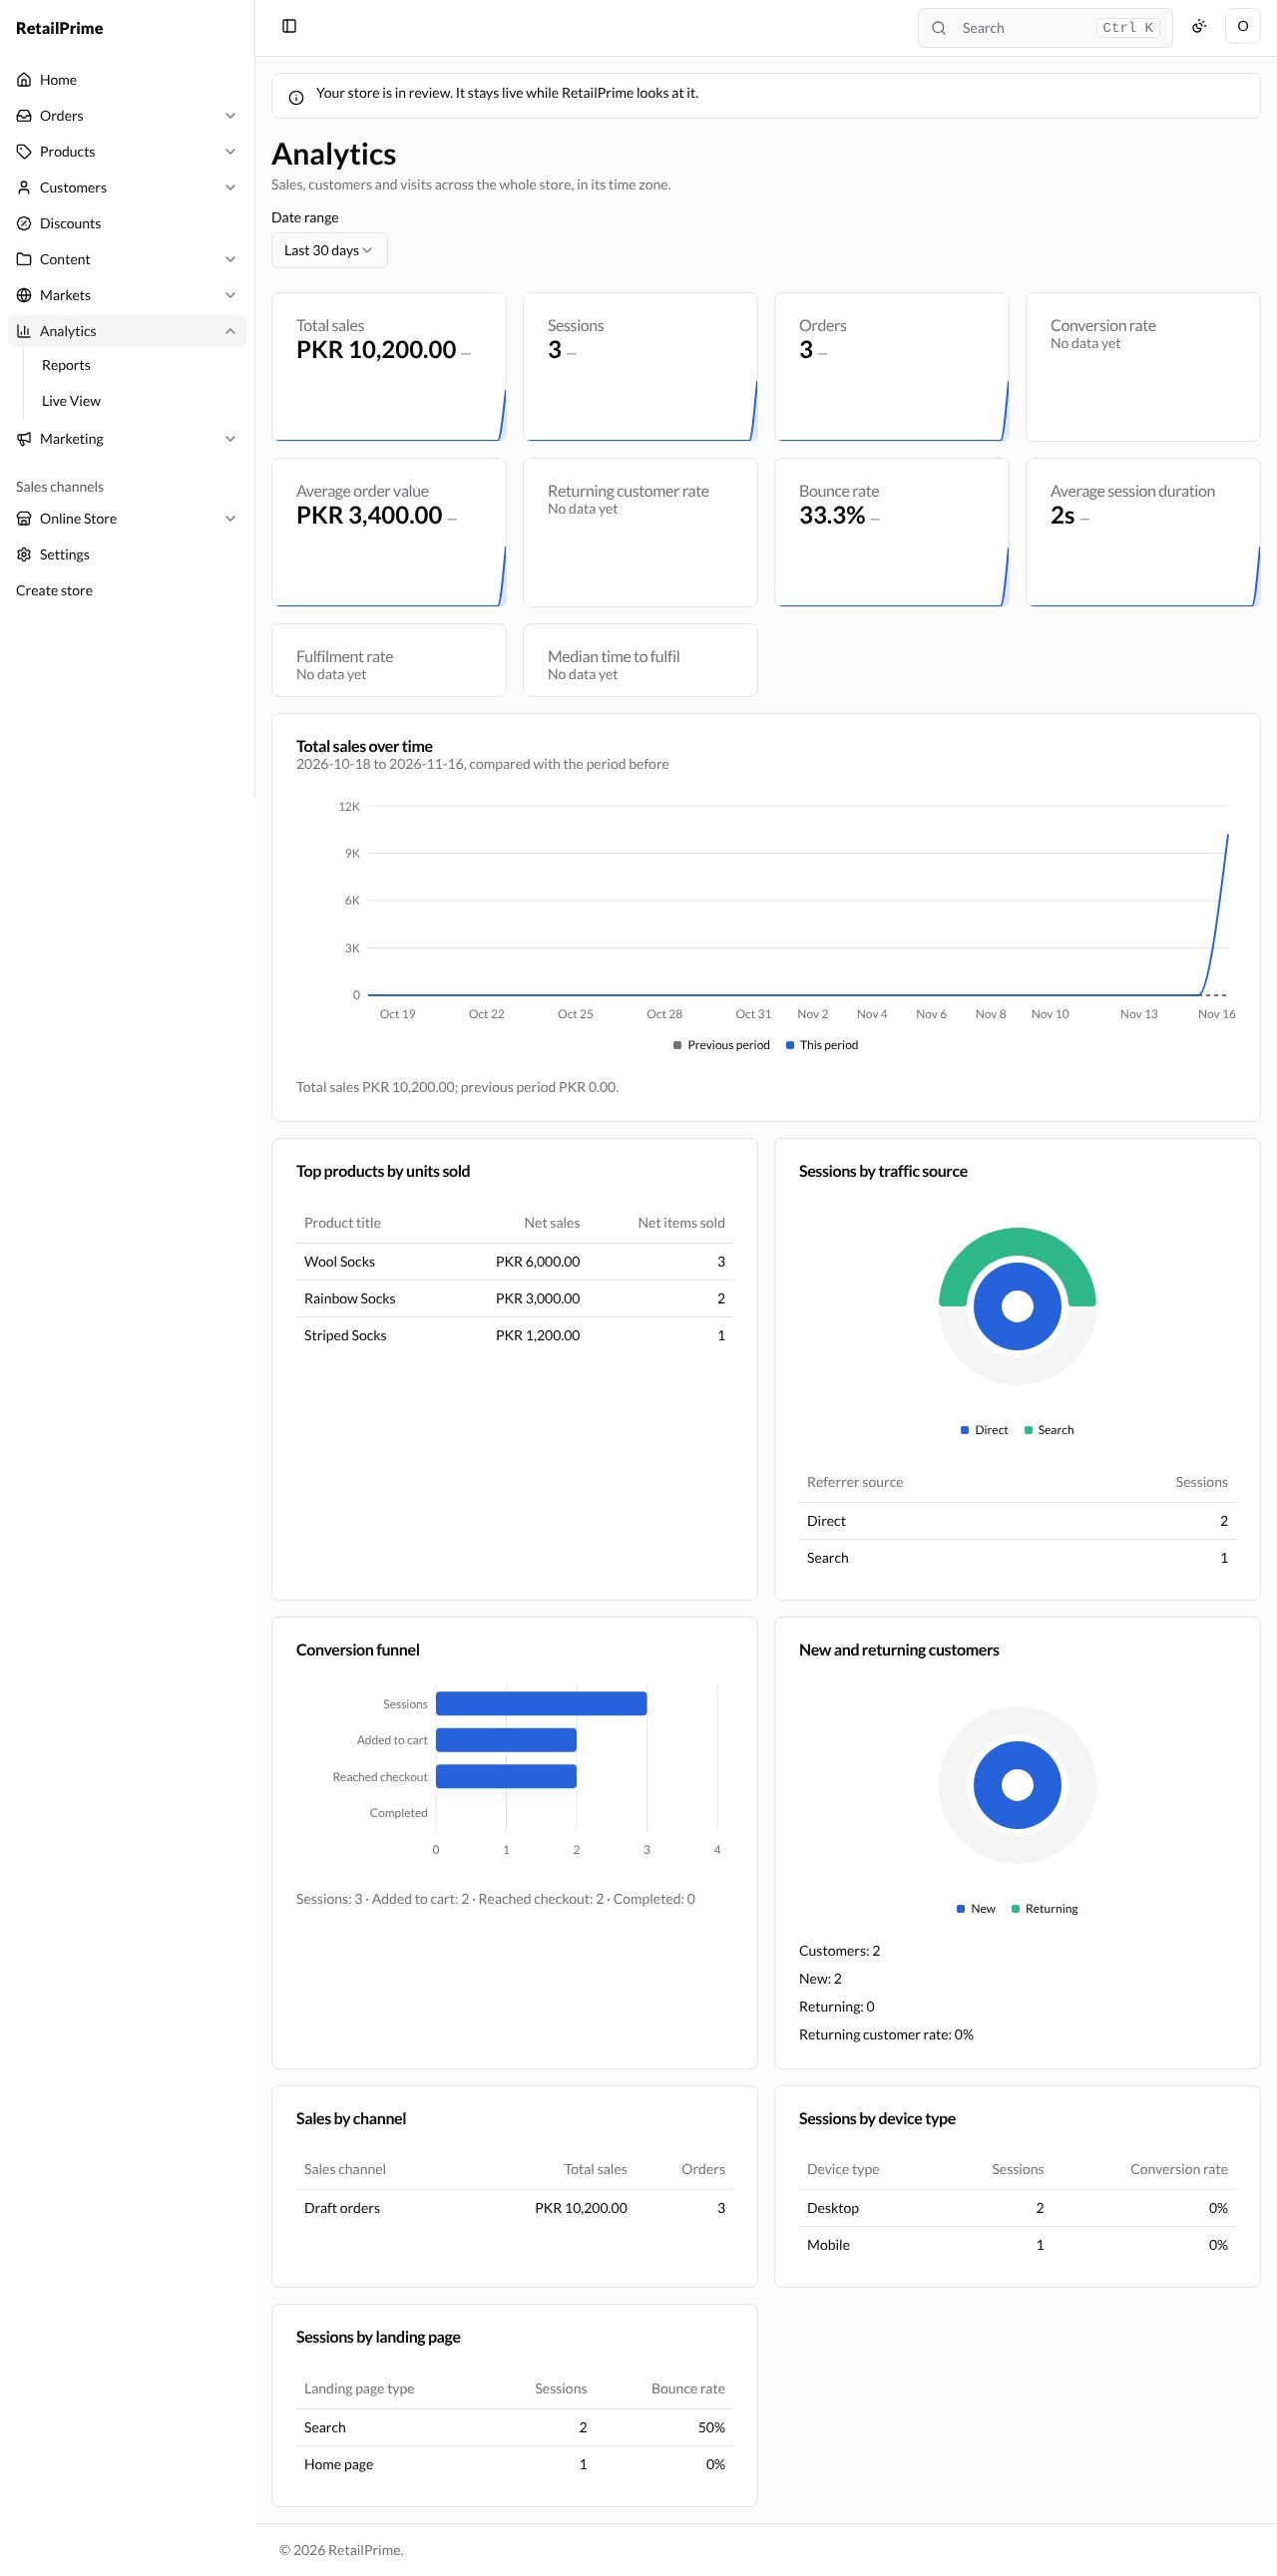
Analytics shows how your whole store is doing: what you sold, how many people visited, where they came from and who bought.
Open Analytics
In the sidebar, press Analytics. The page says Sales, customers and visits across the whole store, in its time zone. It opens on the Last 30 days.
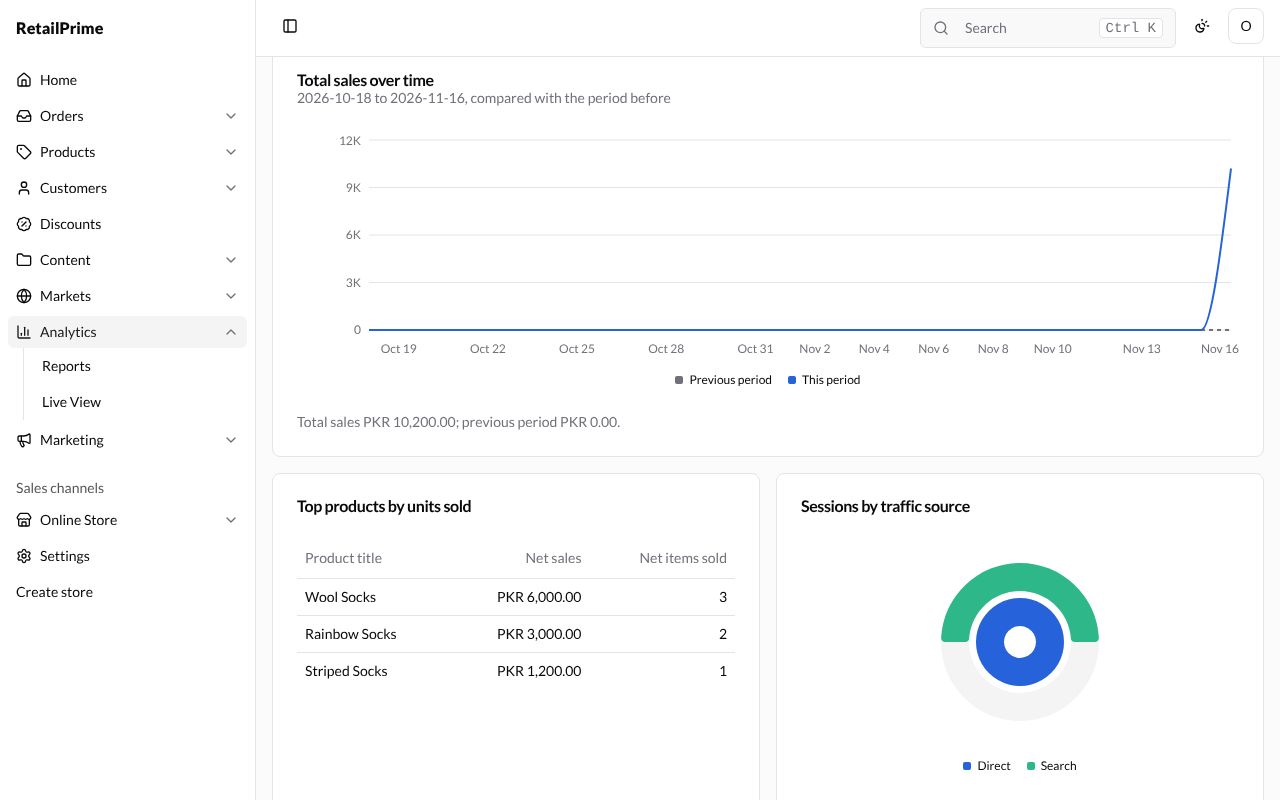
Here is the whole page for a store with three draft orders and a few visitors:
Choose the dates
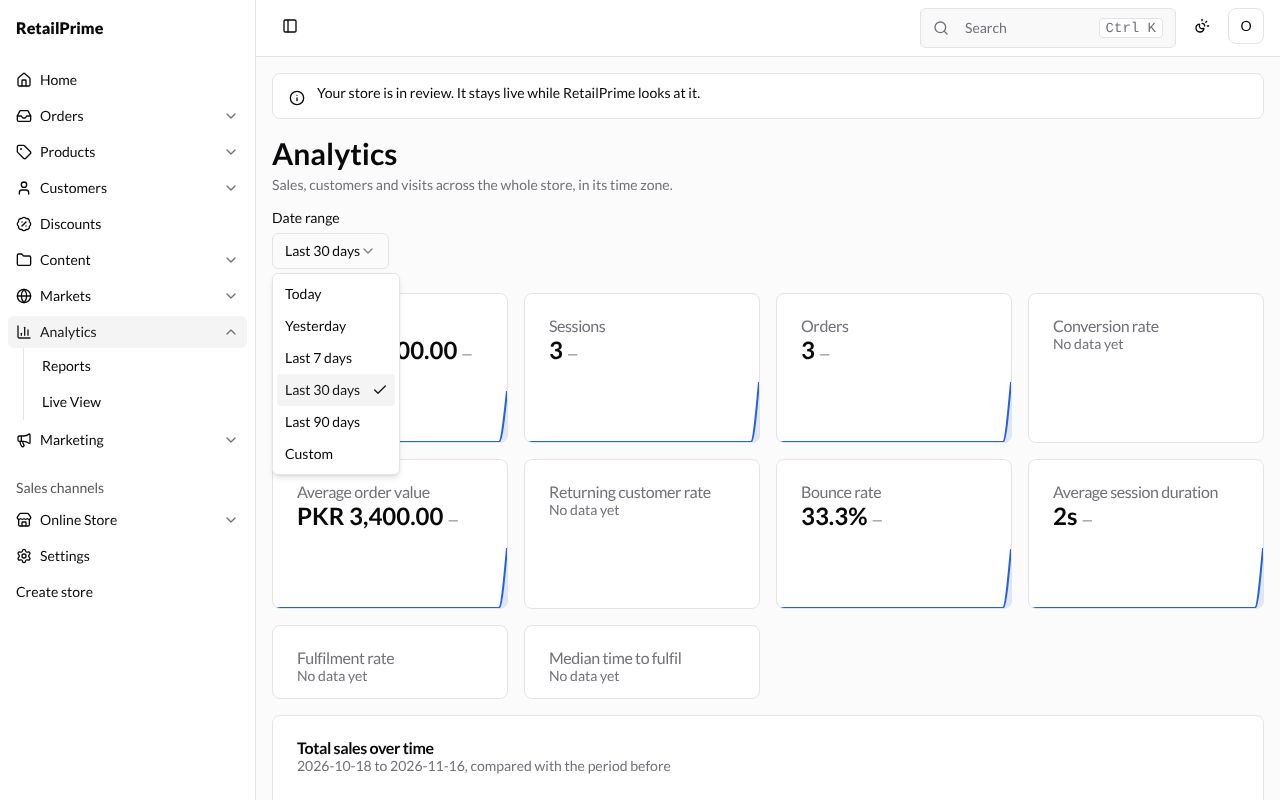
Press Date range at the top. Choose Today, Yesterday, Last 7 days, Last 30 days, Last 90 days or Custom.
With Custom, two boxes appear, From and To: choose the first and the last day.
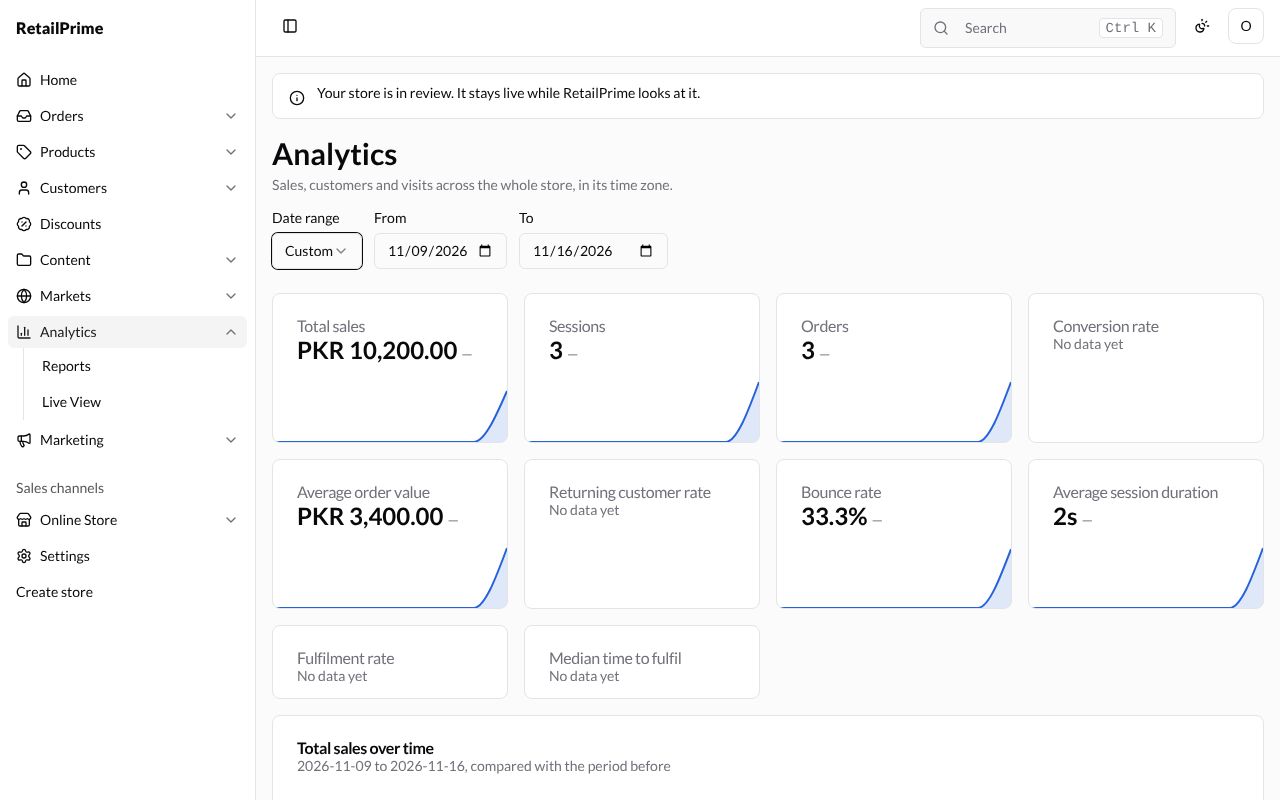
Every card on the page changes to the dates you chose.
The figure cards
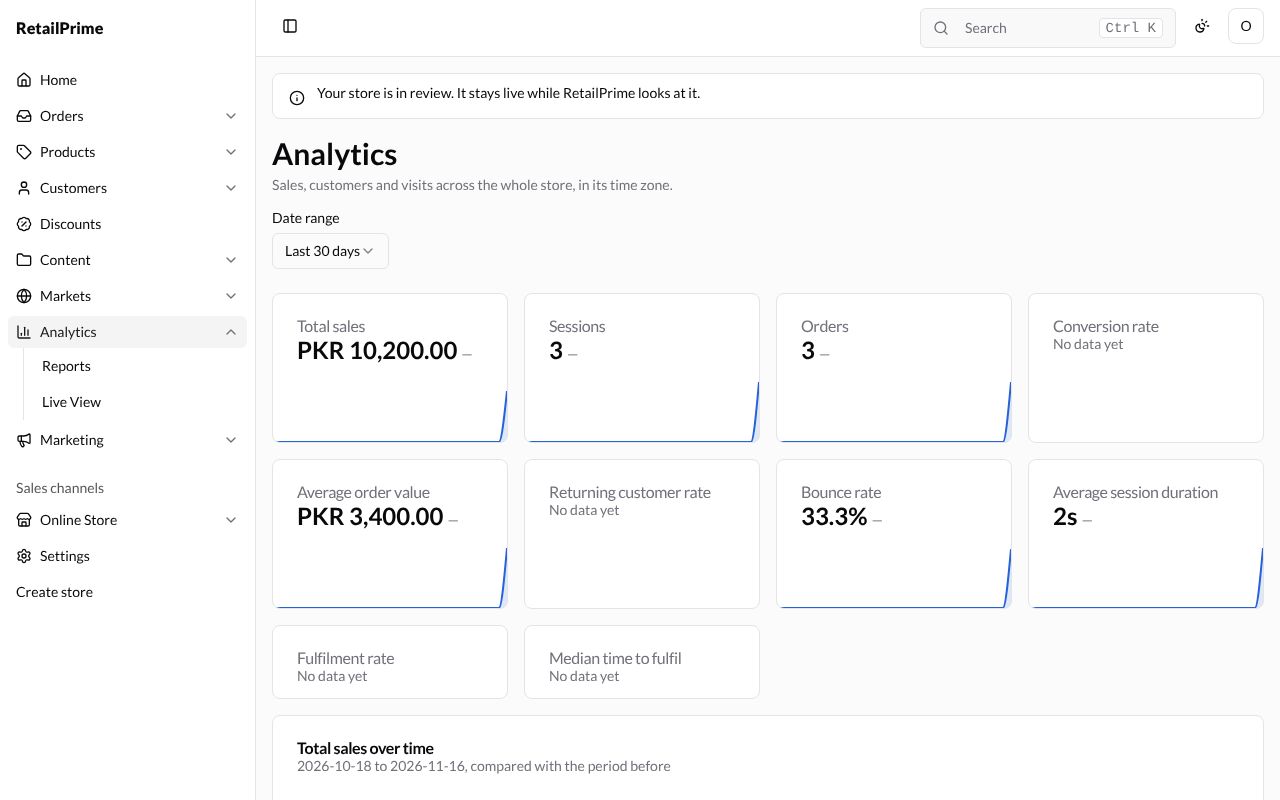
| Card | What it shows |
|---|---|
| Total sales | What your orders came to |
| Sessions | Visits to your store |
| Orders | How many orders |
| Conversion rate | The share of visits that ended in an order |
| Average order value | Total sales divided by orders |
| Returning customer rate | The share of customers who had ordered before |
| Bounce rate | The share of visits that saw only one page |
| Average session duration | How long a visit lasted |
| Fulfilment rate | The share of orders that were fulfilled |
| Median time to fulfil | How long orders took to be fulfilled |
Each card shows the change from the period before (a dash — when there was nothing before) and a small line chart by day. A card with nothing to show says No data yet. Press a card’s title to open its report.
Total sales over time
A line chart of your sales by day, This period against the Previous period, with a line under it such as Total sales PKR 10,200.00; previous period PKR 0.00. When there were no sales, it says No sales in these dates yet.
The other cards
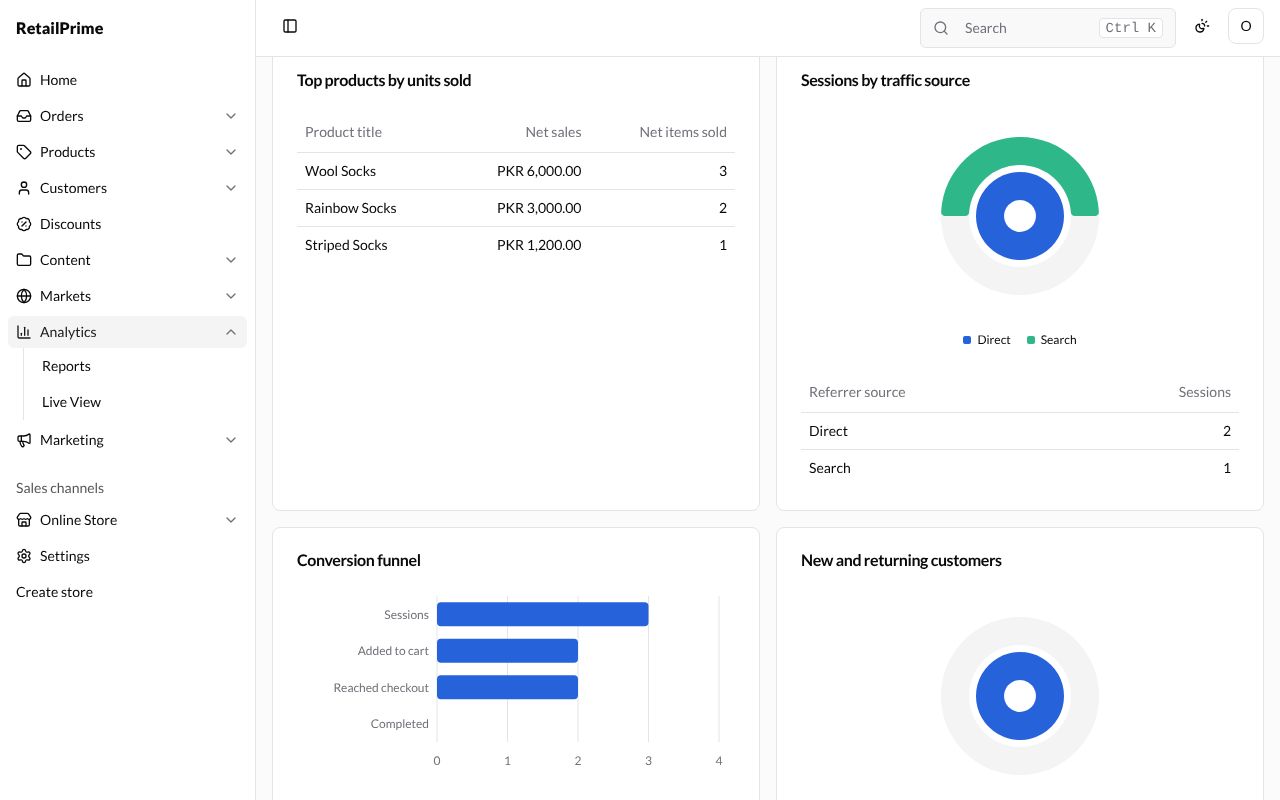
| Card | What it shows |
|---|---|
| Top products by units sold | Your best products with Net sales and Net items sold |
| Sessions by traffic source | Where visitors came from, such as Direct or Search, as a ring chart and a table |
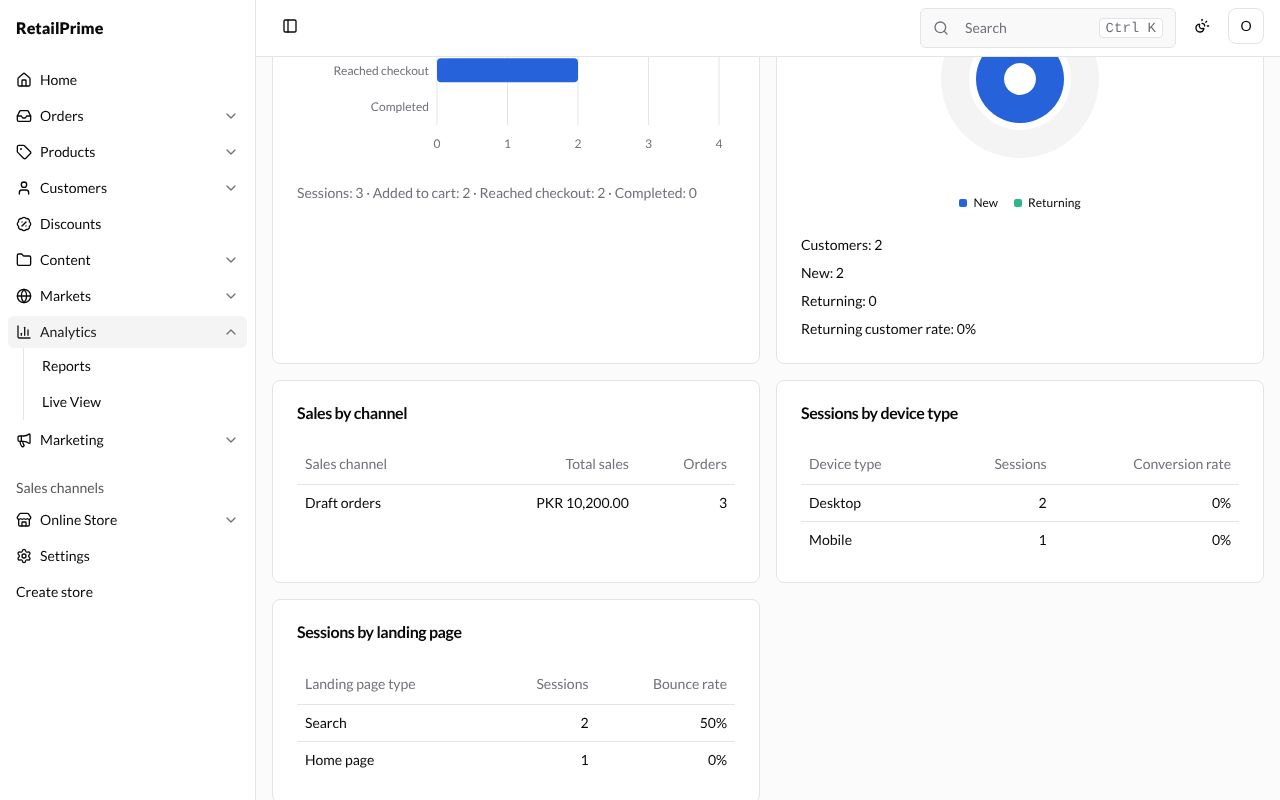
| Conversion funnel | How many visits reached each step: Sessions, Added to cart, Reached checkout, Completed |
| New and returning customers | Customers, New, Returning and Returning customer rate |
| Sales by channel | Sales and orders by where the order was made, such as Draft orders |
| Sessions by device type | Visits from Desktop and Mobile, with their conversion rate |
| Sessions by landing page | The kind of page visits started on, such as Home page or Search, with the bounce rate |
When there were no visits, the traffic and funnel cards say No sessions in these dates yet., and a table with nothing in it says No data yet.
What’s next
Reports: every figure in detail, and reports of your own.